Continuity and Differentiability explored on the TI-89/92
The DATA-Matrix editor is an excellent tool to support concepts of accumulation points, limits, continuity, average and instantaneous rates of change.
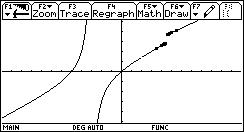
I´ll demonstrate the possibilities using an "exotic" function.
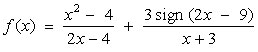
Which values for x are excluded from the domain?
To keep the exploration as general as possible I recommend storing the function as f(x) in the Home Screen.
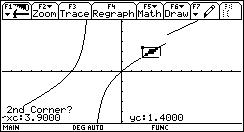
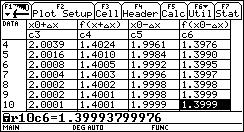
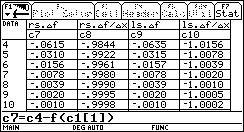
1 Continuity Behaviour at x0 = 3
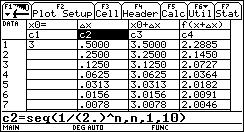
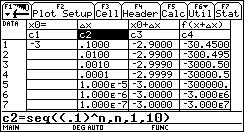
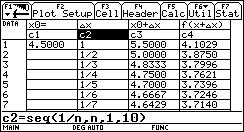
define a 0-sequence to obtain in c3 a sequence
of x-values with rightside limit 3. Subsequently in
c4 we can see the sequence of function values
which should tend to f(x0).
(Experiment changing the sequence in c2).
For c3 enter: c1[1]+c2
For c4 enter: f(c3)
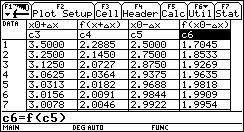
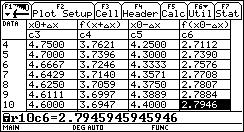
In columns c5 and c6 we generate the left sided approach.
How should we change c2 to accelerate the convergence?
2 Continuity Behaviour at x0 = -3
3 Continuity Behaviour at x0 = 4.5
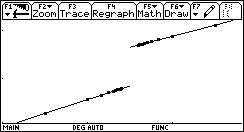
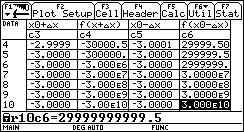
4 The last interesting position is x0 = 2
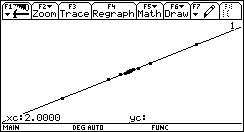
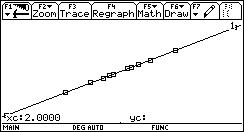
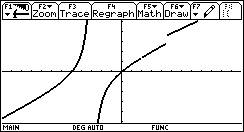
Discuss all the messages given on the screen.
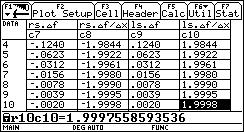
Now it is easy to extend this table for further use in calculus teaching. We only have to add some rows for the absolute changes and then for the rates of change leading to the average rate of change and to its limit.
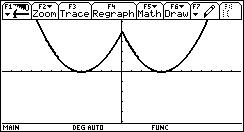
Let´s have another "artificial" function. We only have to add some columns for the "Marilyn Monroe Curve"?
Use various sequences for approaching x = 0. Is the function continuous for x = 0?
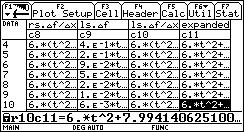
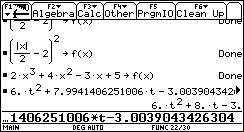
Copy and paste content of cell r10c11 into the Home Screen and try to make conclusions for a general rule to find a formula for the instantaneous rate of change.
Describe also the
"last" elements in columns c4 and c6 - repeating and deepening continuity.
Overall I´d recommend to start the investigations presented above in connection
with a problem from applied mathematics. It is my experience that students
then like to follow very "inner mathematical" reasoning.
I want to give full credit to David Bowers who gave a marvellous workshop in San Francisco and in Liverpool as well showing so many possibilities how to use the TI´s DATA-table in a very meaningful way.
I also want to give credit to attendants of the 1st T3 Winter Academy in Austria (1 - 6 January 2001), who gave the idea of "absolute adressing" a cell in the DATA-table. (K.H.-Keunecke, D.Kirmse, M.Grote).
I´d like to dedicate this paper to Detlev Kirmse who was attacked by an apoplexy of the brain after coming home. All attendants wish Detlev the best for his recovering and hope to discuss and to go skiing with him again next winter.